Let’s explore!

Got 15 minutes to go on a virtual investigation? Or 30 minutes to jump into a hands-on activity? You don’t need a degree to dig into the infinite possibilities of data – just take another look at your own world! Discover how each one of us is continuously producing a digital treasure trove of data that reflects our choices and experiences.
Student interactive

Data in My Day

Grade: 6–12
10–15 minutes
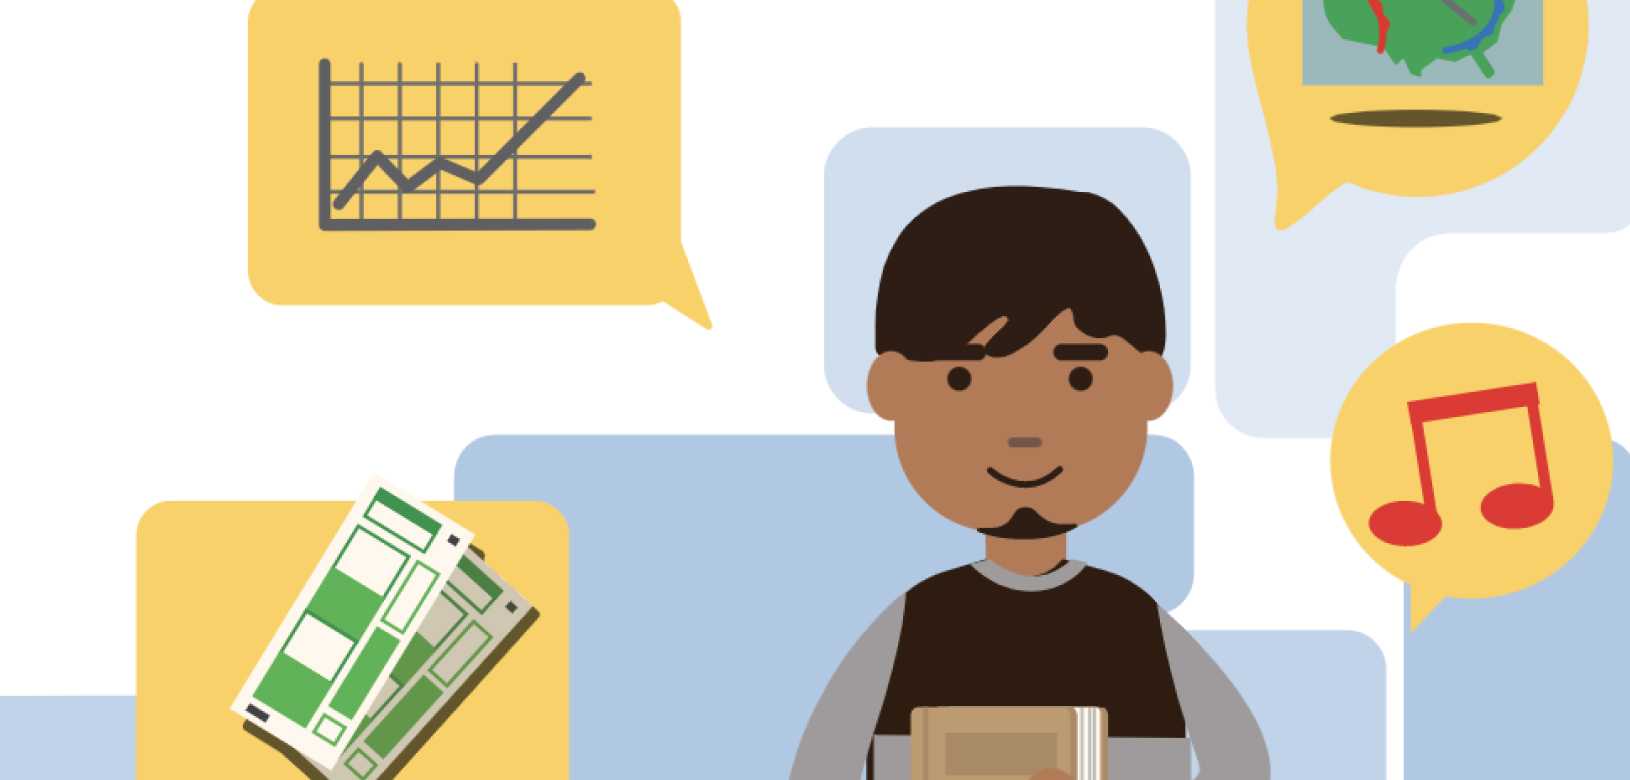
In this self-paced eLearning module, students travel through a typical day to investigate everyday occurrences and discover where and how data and data science play a part. Students will explore the many ways data can be used along with various data-driven careers.

Ready-to-use activities

Do data YOUR WAY with easy-to-use activities designed for students in Grades 6–8. In 45 minutes or less, each activity introduces a game-changing way of reimagining your world with data!

Student activity
ELA, Math, Science, Social Studies

Environmental Justice

Grade: 6–12

Students will use data to gain an understanding of the effects of climate change, while also learning more about environmental justice to enable a more equitable world.

Includes data sets + editable student learning slides:

  • Climate change and social vulnerability in the United States
  • Vital signs of our planet
  • Climate change projections and solutions
  • Collecting data
  • Vocabulary
Student activity
ELA, Math, Science, Social Studies

Access to Health Services

Grade: 6–12

Students will use data to understand ongoing barriers to global healthcare access, exacerbated by the COVID-19 pandemic, before coming up with potential solutions to address gaps in healthcare access locally and globally.

Includes data sets + editable student learning slides:

  • SCORE Data, World Health Organization
  • U.S. mental health data
  • Correlation between life expectancy and income
  • Collecting data
  • Vocabulary
Student activity
ELA, Math, Science, Social Studies

Social Media and Misinformation

Grade: 6–12

Take a closer look at just how plugged-in people today are with social media. Students will use data to understand the power of influencers, uncover the trends of information as it spreads on social media, and brainstorm their own ideas to counteract the dangers of misinformation.

Includes data sets + editable student learning slides:

  • The influence of influencers
  • The world’s top 50 social media influencers
  • Correlations; susceptibility to misinformation
  • Collecting data
  • Vocabulary
Student activity
ELA, Math, Science, Social Studies

Women and Gender Equity at 100

Grade: 6–12
Explore how much gender equity has improved in the U.S. by investigating data on women’s changing roles in entertainment, professional sports, and leadership.
Student activity
ELA, Math, Science, Social Studies

Using the Census for a Snapshot

Grade: 6–12
Dig into real U.S. population Census data from the past to discover remarkable changes in population density, diversity, and voting participation.
Student activity
ELA, Math, Science, Social Studies

Understanding the Election Cycle

Grade: 6–12
Investigate voting participation rates in elections, the impact of advanced data on campaign advertisements, and the evolving impact of media consumption and election information.
Student activity
ELA, Math, Science, Social Studies

Data During the Holidays

Grade: 6–12
Find out how predictable the average person’s shopping habits are during the holidays with national data, then collect data from family and friends!
Student activity
ELA, Math, Science, Social Studies

Big Data in the Big Game

Grade: 6–12
Duration of Length
Go behind-the-scenes of the Big Game to see what consumer data surrounding championship football can tell you about the fans, the fun, and the food.
Student activity
ELA, Math, Science, Social Studies

Data Gets Green

Grade: 6–12
Learn if “going green” requires companies to spend more or make more as you step into the role of an innovator using data to solve environmental challenges.

Explore careers in data

Careers in data can be found in just about any industry you can think of. From creative thinkers to business leaders to number-crunchers, everyone can find a career they care about using the infinite potential of data.

Client Solutions Executive

As a Client Solutions Executive, Janay ensures that businesses and other organizations receive the specific data they need based on their individual goals. Watch as she explains how data can even be used to detect things like seasonal consumer habits.

Director of Client Solutions

As a Director of Client Solutions, Andrew and his team use data to help TV networks understand who is watching so that they can best reach their audience. Learn how Andrew uses data to make his travel plans.
Everyday life is a never-ending source of raw data full of deep insights into our world.